

Particle Size and Zeta Potential Analysis Services
Particle size and surface charge represent the two most fundamental physicochemical parameters governing nanomaterial behavior. Size determines optical properties, cellular uptake pathways, circulation half-life, and catalytic activity. Surface charge, expressed as zeta potential, controls colloidal stability, protein interactions, and membrane permeability. Accurate, reproducible measurement of both properties is indispensable for formulation development, batch release, and regulatory documentation.
At Eata Nanomaterials, our particle characterization laboratory operates a multi-technique platform encompassing dynamic light scattering, nanoparticle tracking analysis, electrophoretic light scattering, and laser diffraction. Each technique addresses distinct size ranges and sample types, enabling us to match the optimal analytical method to your specific material system and research question.
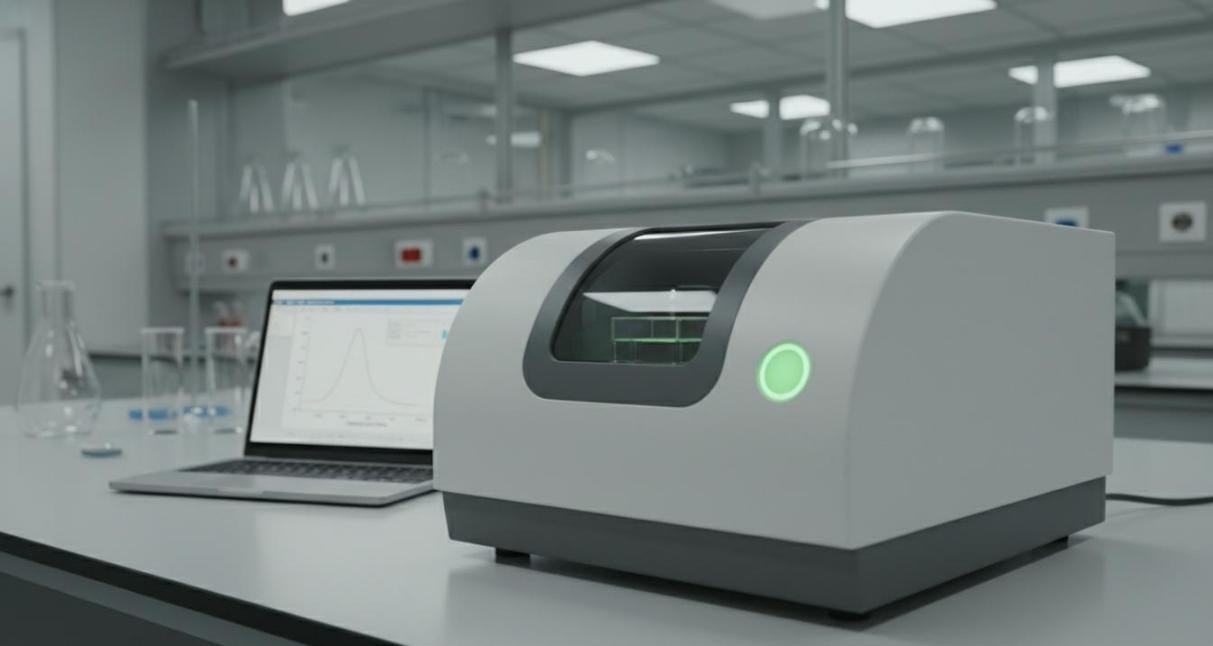 Figure 1: A dynamic light scattering particle size analyzer with sample compartment and laptop displaying size distribution data.
Dynamic Light Scattering for Rapid Size Determination
Dynamic light scattering (DLS) measures the time-dependent fluctuations in scattered laser light intensity caused by Brownian motion of particles in suspension. Smaller particles diffuse more rapidly, producing faster intensity fluctuations, while larger particles generate slower variations. Through autocorrelation analysis and the Stokes-Einstein equation, these fluctuations translate into hydrodynamic diameter distributions.
The hydrodynamic diameter reported by DLS encompasses not merely the particle core but also surface-bound solvent layers, adsorbed ions, and attached ligands. This makes DLS uniquely informative for assessing how surface modifications alter effective particle dimensions in their native liquid environment.
Our DLS analysis services deliver:
- Z-average diameter, the intensity-weighted mean hydrodynamic size optimized for monomodal and weakly polydisperse samples
- Polydispersity index (PDI) quantifying sample uniformity, with values below 0.1 indicating monodisperse populations and values above 0.4 suggesting significant heterogeneity
- Intensity, volume, and number-weighted size distributions providing different perspectives on particle populations
- Temperature-dependent size measurements revealing thermoresponsive behavior or aggregation onset
- Time-course stability monitoring tracking size evolution during storage or accelerated stress testing
 Figure 2: A visualization of nanoparticles undergoing Brownian motion in a liquid medium, with smaller particles exhibiting more rapid random movement.
Nanoparticle Tracking Analysis for Individual Particle Resolution
Nanoparticle tracking analysis (NTA) complements DLS by directly visualizing and tracking individual particles through laser-illuminated optical microscopy. Rather than analyzing ensemble scattering, NTA captures video frames of particles moving under Brownian motion, calculates diffusion coefficients for each tracked particle, and constructs size distributions through single-particle statistics.
This particle-by-particle approach confers distinct advantages for complex samples:
- Resolution of multimodal distributions, accurately separating distinct particle populations that DLS reports as a single broad peak
- Absolute particle concentration determination, reporting particles per milliliter across the measured size range
- Fluorescence-mode tracking selectively analyzing labeled particles within complex biological matrices
- Direct visual confirmation of particle morphology, aggregation state, and contamination presence
NTA excels for exosome and extracellular vesicle characterization, liposome quality control, viral particle quantification, and protein aggregate detection. Our optimized protocols achieve coefficient of variation below 5 percent for well-prepared samples.
 Figure 3: A particle size distribution curve with shaded area and decreasing particle sizes illustrating the size range concept.
Laser Diffraction for Broad-Range Size Distribution
Laser diffraction, also known as static light scattering, measures the angular distribution of light scattered by particles as they pass through a laser beam. Large particles scatter predominantly at small forward angles, while small particles generate wider scattering patterns. Mathematical inversion using Fraunhofer or Mie theory converts the scattering pattern into a volume-weighted particle size distribution.
Our laser diffraction services span an extraordinarily broad dynamic range from 0.02 micrometers to 3.5 millimeters, accommodating:
- Dry powder dispersions for pharmaceutical excipients, ceramic powders, and metal alloy feedstocks
- Wet liquid dispersions for nanoparticle suspensions, emulsions, and slurries
- Spray analysis characterizing aerosol droplet distributions in pharmaceutical inhaler development
- ISO 13320 compliant measurements ensuring reproducibility and regulatory acceptance
For sub-micron transparent or translucent particles, Mie theory calculations incorporate complex refractive indices of both particles and dispersant, ensuring accuracy unavailable with Fraunhofer approximations alone.
Zeta Potential Measurement and Surface Charge Analysis
Zeta potential quantifies the electric potential at the slipping plane surrounding a charged particle in suspension. This parameter serves as the primary indicator of colloidal stability: high absolute values generate strong electrostatic repulsion preventing aggregation, while values near zero permit van der Waals attraction to dominate, causing flocculation.
We employ electrophoretic light scattering (ELS) as our primary zeta potential measurement technique. When an electric field applies across the sample cell, charged particles migrate toward the oppositely charged electrode. Laser Doppler velocimetry measures this electrophoretic mobility, which is converted to zeta potential through appropriate electrokinetic models.
| Zeta Potential Range | Colloidal Stability | Interpretation |
| +30 mV or higher | Highly stable | Strong positive charge, excellent dispersion |
| +10 to +30 mV | Moderately stable | Adequate repulsion, may need steric stabilization |
| -10 to +10 mV | Unstable | Minimal repulsion, rapid aggregation likely |
| -30 to -10 mV | Moderately stable | Adequate negative charge, monitor closely |
| -30 mV or lower | Highly stable | Strong negative charge, excellent dispersion |
 Figure 4: A close-up of a zeta potential measurement cuvette with electrodes immersed in a colloidal dispersion.
Advanced Zeta Potential Capabilities
Beyond single-point measurements, we offer comprehensive zeta potential profiling services that map how surface charge evolves under changing environmental conditions:
- pH titration curves determining the isoelectric point (IEP) where zeta potential crosses zero, critical for understanding protein adsorption and surface modification success
- Ionic strength dependence studies revealing electric double layer compression effects on colloidal stability under physiological salt concentrations
- Temperature-dependent zeta potential measurements tracking thermally induced surface charge alterations
- Surfactant and polyelectrolyte titration quantifying the amount of charged additive required to reverse particle surface charge
These advanced profiles prove invaluable when designing nanoparticle formulations for biological environments where pH, ionic strength, and protein concentration vary dramatically between bloodstream, tumor microenvironments, and intracellular compartments.
Technique Selection Guide
Choosing the appropriate characterization technique ensures meaningful, actionable results. The following guidance maps common sample types and research objectives to our recommended analytical approach:
| Sample / Objective | Recommended Technique | Size Range |
| Monodisperse nanoparticles in solution | DLS | 0.3 nm to 10 um |
| Polydisperse or multimodal samples | NTA | 10 nm to 2 um |
| Broad size range powders / emulsions | Laser Diffraction | 0.02 um to 3.5 mm |
| Exosomes / extracellular vesicles | NTA | 50 to 1000 nm |
| Colloidal stability screening | DLS + Zeta Potential | 0.3 nm to 10 um |
| Surface charge after modification | Zeta Potential (ELS) | 3.8 nm to 100 um |
 Figure 5: Four cuvettes containing different colloidal dispersions for particle size and zeta potential analysis.
Applications Across Research and Development
Our particle size and zeta potential analysis services support diverse research programs spanning academia and industry:
- Pharmaceutical formulation development optimizing liposome and lipid nanoparticle size for targeted delivery, and confirming batch-to-batch consistency for regulatory submissions
- Nanotoxicology studies correlating particle dimensions and surface charge with cellular uptake, inflammatory response, and biodistribution outcomes
- Catalyst development characterizing supported metal nanoparticle sizes and their relationship to catalytic turnover frequencies
- Cosmetic and personal care formulation ensuring pigment dispersion stability and sunscreen nanoparticle compliance with regulatory size thresholds
- Food and beverage quality control monitoring emulsion droplet sizes and creaming stability in plant-based milk and nutritional formulations
- Environmental science assessing engineered nanomaterial fate and transport in aqueous ecosystems through aggregation kinetic studies
Analysis Deliverables and Reporting
Every analysis project includes a comprehensive report containing raw measurement data, processed results with statistical analysis, methodology documentation, and expert interpretation. Standard deliverables include size distribution profiles, Z-average and PDI values, zeta potential values with standard deviations, instrument parameters and measurement conditions, and recommendations for improving dispersion stability or measurement reproducibility.
For ongoing development programs, we offer comparative batch summaries tracking size and zeta potential trends across multiple production runs, enabling early detection of process drift and supporting continuous improvement initiatives.
Submit Your Samples for Particle Characterization
Whether you need rapid size confirmation for a single batch or comprehensive stability profiling across multiple formulation conditions, Eata Nanomaterials provides precise, reproducible particle size and zeta potential analysis backed by decades of collective experience in nanomaterial characterization.
Contact our analytical team to discuss your sample type, desired measurements, and reporting requirements. We will recommend the optimal techniques and provide guidance on sample preparation and shipping to ensure the highest quality results.