

Optical and Photoluminescence Characterization Services
The interaction between light and nanomaterials gives rise to a rich spectrum of phenomena that encode critical information about size, structure, composition, and surface chemistry. Metallic nanoparticles exhibit size-tunable surface plasmon resonances. Quantum dots emit light with wavelength dictated by their dimensions. Perovskite nanocrystals demonstrate extraordinarily high photoluminescence quantum yields. Two-dimensional materials display layer-dependent optical bandgaps. Characterizing these optical signatures is fundamental to developing structure-property relationships and advancing nanomaterial applications.
At Eata Nanomaterials, our optical characterization laboratory is equipped with state-of-the-art instrumentation for absorption spectroscopy, steady-state photoluminescence, time-resolved fluorescence lifetime measurement, and absolute photoluminescence quantum yield determination. Our analytical team delivers precise, reproducible measurements across the ultraviolet to near-infrared spectral range, providing the quantitative optical data your research demands.
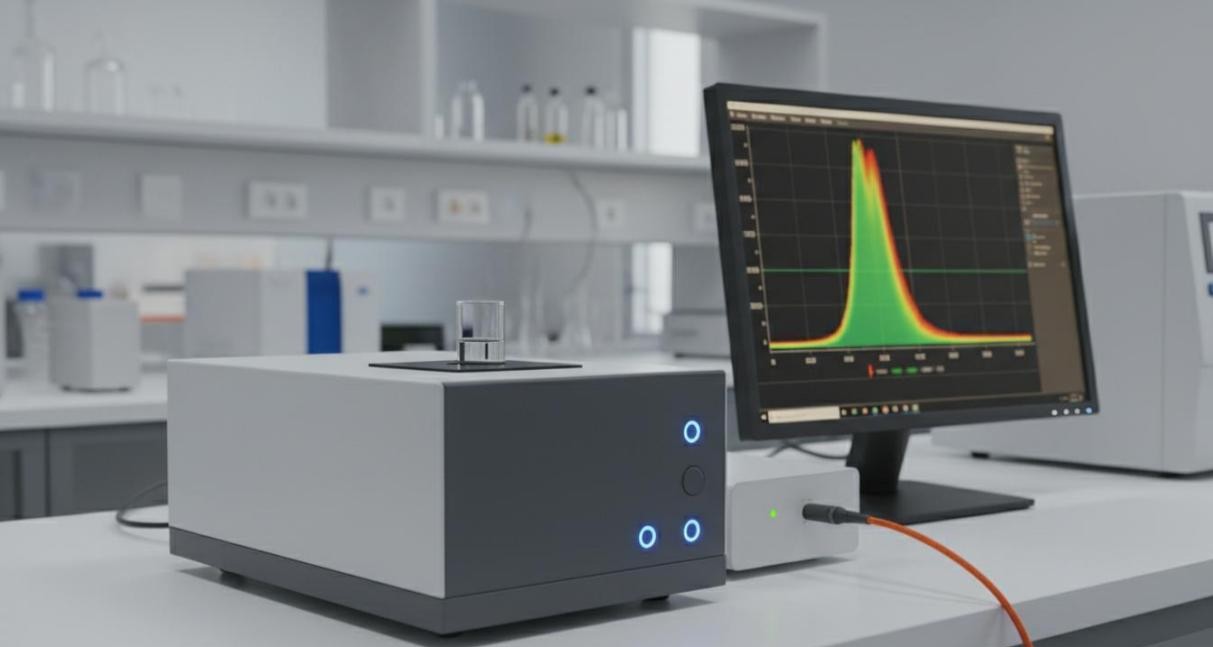 Figure 1: A spectrofluorometer system for photoluminescence characterization with cuvette sample compartment and monitor displaying an emission spectrum.
UV-Visible Absorption Spectroscopy
UV-Vis absorption spectroscopy measures how nanomaterials interact with light across the ultraviolet and visible spectrum. When photons encounter nanoparticles, they can be absorbed through electronic transitions, localized surface plasmon resonance, or excitonic processes. The resulting absorption spectrum serves as a rapid, non-destructive fingerprint revealing bandgap energy, plasmon resonance position, excitonic fine structure, and concentration.
Our UV-Vis analysis services cover:
- Bandgap determination through Tauc plot analysis of absorption edge data, differentiating direct and indirect transitions in semiconductor nanocrystals
- Surface plasmon resonance characterization for gold and silver nanoparticles, tracking LSPR position, intensity, and linewidth as indicators of size, shape, and aggregation state
- Excitonic peak analysis for quantum dots revealing quantum confinement strength and size distribution homogeneity
- Concentration quantification using Beer-Lambert law with material-specific extinction coefficients
- Kinetic monitoring of nanoparticle growth, aggregation, or degradation through time-dependent absorbance tracking
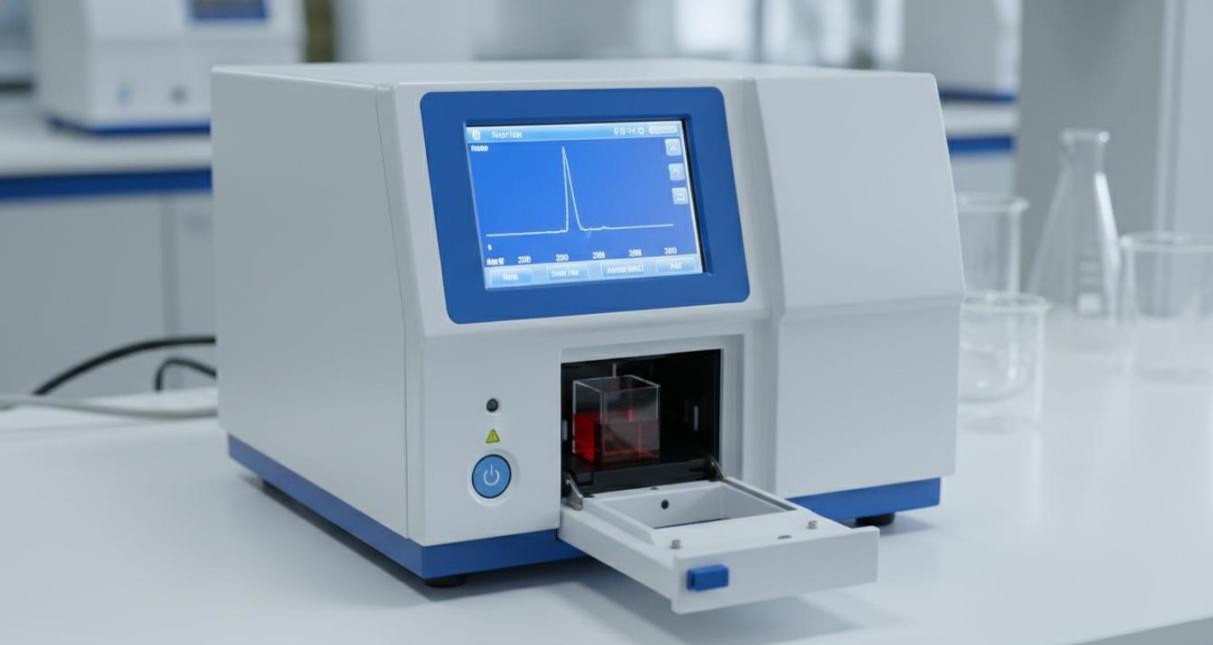 Figure 2: A UV-Vis spectrophotometer with a cuvette containing red colloidal gold nanoparticles and digital display showing an absorption spectrum.
Steady-State Photoluminescence Spectroscopy
Photoluminescence spectroscopy probes the radiative relaxation pathways that occur after a nanomaterial absorbs light. By exciting the sample with a monochromatic light source and collecting the emitted fluorescence, we obtain a detailed picture of the electronic structure, defect states, and surface passivation quality. This technique is indispensable for characterizing quantum dots, perovskite nanocrystals, carbon dots, upconversion nanoparticles, and fluorescent organic dyes.
Our steady-state PL capabilities include:
- Emission spectral scanning across 250 to 1700 nm with excitation-tunable monochromators enabling selective excitation of specific electronic transitions
- Excitation-emission matrix (EEM) mapping where emission spectra are collected at multiple excitation wavelengths, revealing complex luminescence landscapes in multicomponent systems
- Emission peak position and full width at half maximum analysis quantifying spectral purity and size distribution homogeneity
- Stokes shift calculation correlating absorption and emission energies to assess electron-phonon coupling and structural relaxation effects
- Temperature-dependent photoluminescence from liquid nitrogen to 300 degrees Celsius revealing thermal quenching mechanisms and phase transitions
 Figure 3: Size-dependent photoluminescence of quantum dots showing emission color evolution from blue to red with increasing particle size.
Photoluminescence Quantum Yield Measurement
Photoluminescence quantum yield (PLQY) defines the efficiency with which a material converts absorbed photons into emitted photons. This parameter serves as the primary figure of merit for emissive nanomaterials used in displays, solar concentrators, bioimaging, and sensing applications. A high PLQY indicates dominant radiative recombination pathways, while a low value signals substantial non-radiative losses through defects, traps, or surface states.
We employ the integrating sphere method for absolute PLQY determination, which directly measures the number of photons absorbed and emitted without requiring reference standards. A high-reflectance sintered PTFE integrating sphere captures all scattered excitation light and emitted fluorescence, eliminating geometric errors and directional bias that compromise conventional relative methods.
Our PLQY workflow proceeds through systematic steps:
- Sample preparation at optical density below 0.2 to minimize reabsorption effects, with matched blank reference for baseline correction
- Excitation wavelength selection well-separated from emission to enable clean spectral deconvolution
- Radiometrically calibrated detection ensuring wavelength-independent photon counting accuracy
- Reabsorption correction through tail-matching for samples with low Stokes shift or high optical density
For samples measured outside the integrating sphere, we compare conventional PL spectra with sphere-acquired data, normalizing at the red emission tail where reabsorption is minimal, to quantify and correct the proportion of emission lost to self-absorption.
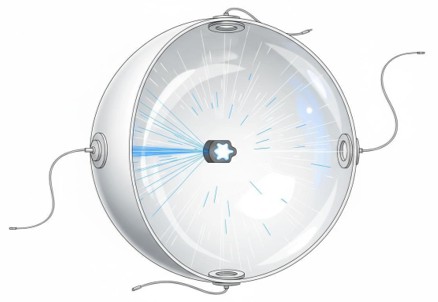 Figure 4: A cutaway illustration of an integrating sphere showing the sample at the center with light rays diffusely reflecting from the PTFE-coated interior walls.
Time-Resolved Photoluminescence and Fluorescence Lifetime
While steady-state PL reveals what light a material emits, time-resolved photoluminescence (TRPL) uncovers how quickly emission occurs after excitation. Fluorescence lifetime measurements probe the excited-state dynamics that govern energy transfer, charge separation, and non-radiative recombination. These kinetics are exquisitely sensitive to the local nanoscale environment, making lifetime analysis a powerful tool for understanding surface defects, quencher interactions, and energy migration processes.
We utilize time-correlated single-photon counting (TCSPC) as our primary fluorescence lifetime technique. TCSPC excels in sensitivity, dynamic range, and temporal precision, measuring single photons at the quantum detection limit. A pulsed laser excites the sample, and the arrival time of each emitted photon is precisely recorded relative to the excitation pulse. After accumulating millions of such events, a fluorescence decay histogram is constructed with picosecond resolution.
Key capabilities of our TRPL platform include:
- Multi-exponential decay fitting resolving fast and slow emission components attributable to different recombination pathways or emissive species
- Average lifetime calculation weighted by component amplitudes, providing a single-figure comparison metric across samples
- Excitation-wavelength-dependent lifetime studies selectively exciting different chromophores or electronic transitions within heterogeneous samples
- Temperature-dependent lifetime measurements from 77 K to 500 K, revealing thermal activation energies of non-radiative processes
- Time-resolved emission spectral scanning where decay curves are collected at multiple emission wavelengths, constructing time-evolving spectral maps
 Figure 5: A fluorescence lifetime decay curve showing the exponential decrease of emitted light intensity following pulsed excitation.
Nanomaterial Classes and Optical Characterization Approaches
| Nanomaterial Type | Key Optical Parameters | Recommended Techniques |
| Quantum dots | Bandgap, PL peak, PLQY, lifetime | UV-Vis, PL, PLQY, TCSPC |
| Perovskite nanocrystals | PLQY, defect emission, stability | PL, PLQY, TRPL, temperature PL |
| Gold / silver NPs | LSPR position, bandwidth | UV-Vis extinction |
| Carbon dots | Excitation-dependent PL, PLQY | EEM mapping, PLQY, TCSPC |
| Upconversion NPs | Emission efficiency, lifetime | PL, PLQY, TRPL, power study |
| 2D materials | Layer-dependent bandgap, excitons | UV-Vis, PL, Raman-PL |
| Fluorescent dyes | Quantum yield, lifetime, Stokes shift | PL, PLQY, TCSPC |
Research Applications
Our optical and photoluminescence characterization services support diverse research programs:
- Synthesis optimization screening batches of quantum dots or perovskite nanocrystals for maximum brightness and spectral purity
- Surface ligand evaluation assessing how different capping agents affect PLQY through surface trap passivation or quenching
- Stability monitoring tracking optical degradation under thermal, photo, or chemical stress for shelf-life prediction
- Display material development tuning emission wavelength and maximizing efficiency for LED and LCD color conversion layers
- Bioimaging probe validation confirming brightness, photostability, and absence of toxic heavy metal leakage in vivo
- Sensor development quantifying fluorescence quenching response to target analytes and determining detection limits
Measurement Deliverables
Every optical characterization project includes a comprehensive report containing:
- Absorption and emission spectra with peak annotations, including corrected and uncorrected data
- Calculated parameters including bandgap, Stokes shift, PLQY with uncertainty, and fitted lifetime components
- Instrument parameters and measurement conditions ensuring reproducibility and traceability
- Publication-ready figures formatted to journal specifications upon request
- Expert interpretation highlighting trends, anomalies, and implications for your specific application
Illuminate Your Research with Precision Optical Characterization
Whether you need rapid PLQY screening for synthesis batches, comprehensive time-resolved studies for mechanistic understanding, or UV-Vis monitoring for stability assessment, Eata Nanomaterials provides precise, reliable optical characterization services tailored to your nanomaterial system.
Contact our analytical team to discuss your sample type, desired measurements, and application goals. We will recommend the optimal techniques and provide guidance on sample preparation requirements.