

Nanomaterial Characterization & Analysis Services
Characterization sits at the heart of every credible nanomaterials research program. Without precise, reproducible analytical data, even the most elegantly synthesized nanomaterial remains an undefined substance. At Eata Nanomaterials, our characterization laboratory operates a comprehensive suite of advanced instrumentation that spans morphological, structural, chemical, optical, thermal, magnetic, electrical, and mechanical property analysis — enabling complete physicochemical profiling of virtually any nanomaterial system.
Every analytical project begins with a consultation to match your material and research question with the most appropriate techniques. We do not merely run instruments and export raw files — our scientists interpret the data, flag anomalies, suggest complementary measurements when needed, and deliver formatted results suitable for direct inclusion in manuscripts, patent filings, or technical reports. The sections below describe our core analytical capabilities in detail.
Morphological and Structural Characterization Services
Understanding the shape, size, and architecture of nanomaterials is fundamental to interpreting their behavior and performance. Our morphological characterization suite combines electron microscopy techniques that resolve features from the micrometer scale down to individual atomic columns. Transmission electron microscopy (TEM) operating at 200 kV provides direct visualization of particle size, shape, crystallinity, and internal structure at resolutions below 0.2 nm. High-angle annular dark-field scanning TEM (HAADF-STEM) delivers Z-contrast imaging that distinguishes elements by atomic number, invaluable for core-shell and heterostructure analysis.
Scanning electron microscopy (SEM) at variable accelerating voltages (1-30 kV) provides rapid topographic imaging of particle ensembles, nanofiber mats, thin films, and bulk nanostructured materials. Our field-emission SEM achieves resolutions of 1.0 nm at 15 kV, sufficient to resolve surface texture and interparticle arrangements. Atomic force microscopy (AFM) complements electron microscopy by measuring three-dimensional surface topography with sub-nanometer height resolution, capturing soft or beam-sensitive materials that may degrade under electron irradiation. AFM phase imaging additionally reveals variations in surface stiffness and adhesion across heterogeneous samples.
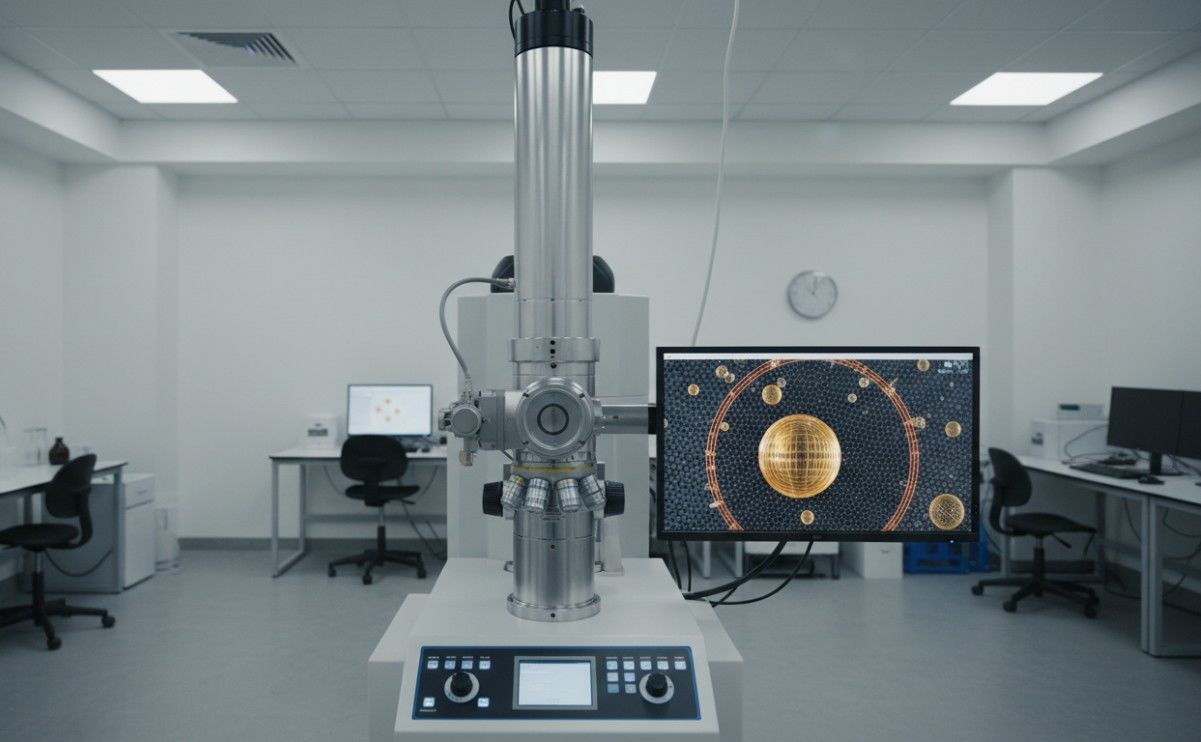 Figure 1: High-resolution transmission electron microscope with nanoparticle imaging display
Deliverables:
- TEM imaging: Bright-field, dark-field, and high-resolution lattice imaging with calibrated magnification.
- STEM-EDS mapping: Elemental distribution maps with spatial resolution approaching the probe size (sub-nm).
- Selected area electron diffraction (SAED): Crystallographic phase confirmation and orientation relationships.
- SEM imaging: Secondary electron and backscattered electron imaging at multiple magnifications.
- AFM topography: 3D height maps, roughness parameters (Ra, Rq, Rz), and particle height distributions.
Particle Size and Zeta Potential Analysis Services
Particle size distribution and surface charge are among the most critical quality attributes for colloidal nanomaterials. Our dynamic light scattering (DLS) instruments measure hydrodynamic diameter distributions in the range of 0.3 nm to 10 um, operating at multiple scattering angles (90 degrees, 173 degrees backscatter) to optimize signal-to-noise across different concentration regimes. The technique provides the intensity-weighted, volume-weighted, and number-weighted size distributions — each offering distinct insights into sample polydispersity. For samples containing large aggregates or dust, our DLS systems include filter-based algorithms and adaptive correlation techniques to isolate the nanoparticle signal.
Zeta potential measurements via phase analysis light scattering (PALS) and electrophoretic light scattering determine the surface charge of nanoparticles suspended in aqueous or organic media. These values predict colloidal stability — dispersions with zeta potentials exceeding plus or minus 30 mV typically remain stable against aggregation for extended periods. We conduct pH-dependent zeta potential titrations to identify the isoelectric point, ionic strength sweeps to assess salt tolerance, and temperature-dependent measurements to evaluate thermal stability of surface charge. Nanoparticle tracking analysis (NTA) provides an orthogonal particle sizing method that resolves individual particles in polydisperse samples, reporting concentration alongside size.
Measurement Specifications:
| Technique | Size Range | Key Output |
| DLS | 0.3 nm - 10 um | Hydrodynamic diameter, PDI |
| Zeta Potential | 5 nm - 10 um | Surface charge, pI, salt stability |
| NTA | 10 nm - 2 um | Individual particle size, concentration |
| Laser Diffraction | 10 nm - 3 mm | Volume-weighted distribution |
Crystallographic and Phase Analysis Services (XRD)
X-ray diffraction is the definitive technique for identifying crystalline phases, determining lattice parameters, estimating crystallite size, and assessing strain in nanomaterials. Our powder XRD systems employ Cu K-alpha radiation in Bragg-Brentano geometry, covering a 2-theta range from 5 to 90 degrees with 0.02-degree step resolution. Phase identification proceeds by matching measured patterns against the ICDD PDF-4+ database, while Rietveld refinement provides quantitative phase abundance, lattice parameters, and site occupancy factors for complex multi-phase mixtures.
For nanocrystalline materials, peak broadening analysis via the Scherrer equation and Williamson-Hall plots extracts average crystallite size and microstrain. Grazing incidence XRD (GIXRD) characterizes thin films and surface layers with controlled penetration depths as shallow as a few nanometers. In-situ XRD with heating stages tracks phase transitions, crystallization kinetics, and thermal expansion in real time. Small-angle X-ray scattering (SAXS) complements wide-angle diffraction by probing nanoscale electron density fluctuations — providing particle size, shape, and interparticle spacing information in disordered systems.
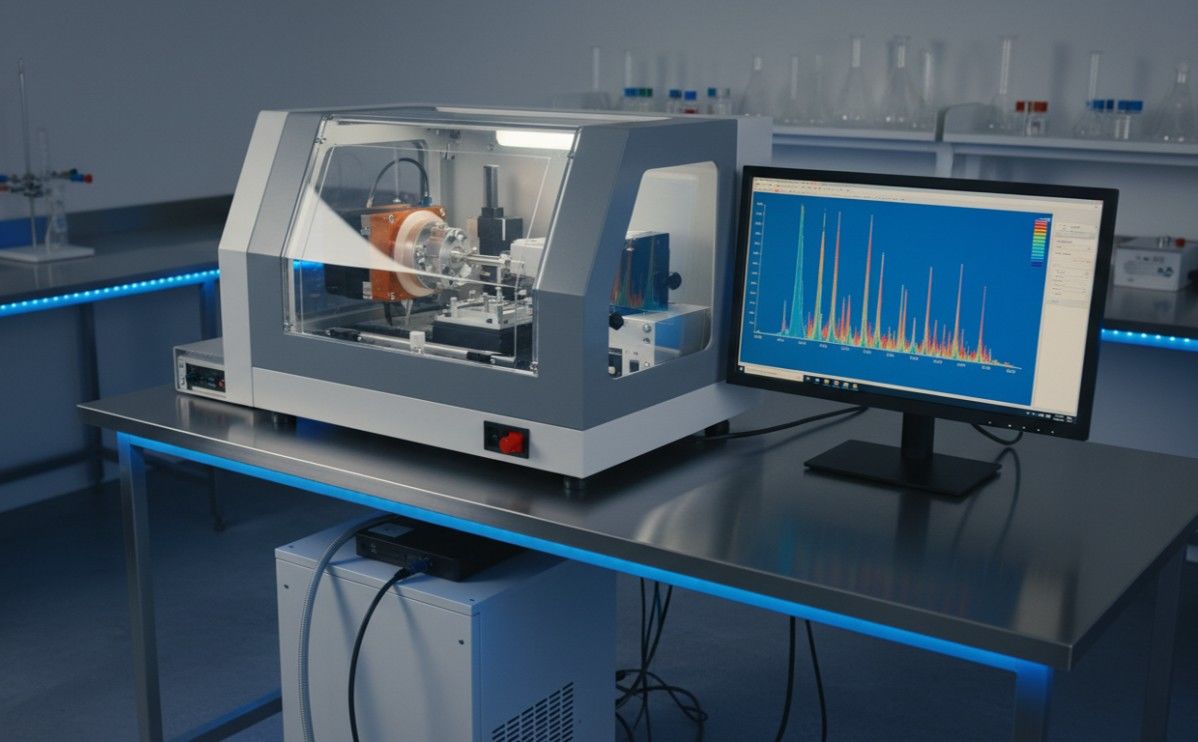 Figure 2: X-ray diffractometer displaying crystalline diffraction patterns for phase identification
XRD Capabilities:
- Phase identification: Database matching against 400,000+ reference patterns in ICDD PDF-4+.
- Rietveld refinement: Quantitative phase analysis, lattice parameters, and crystallographic structure.
- Crystallite size estimation: Scherrer analysis and Williamson-Hall plots for size and strain decoupling.
- Grazing incidence XRD: Thin film texture, orientation, and residual stress analysis.
- In-situ temperature XRD: Phase transitions from room temperature to 1200 degrees C under controlled atmosphere.
- SAXS analysis: Nanoparticle form factors, size distributions, and interparticle correlations.
Surface Chemistry and Composition Analysis Services (XPS/EDS)
The outermost few nanometers of a nanomaterial dominate its interactions with the surrounding environment, making surface chemical characterization indispensable. X-ray photoelectron spectroscopy (XPS) irradiates samples with monochromated Al K-alpha X-rays and measures the kinetic energy of emitted photoelectrons, yielding elemental composition and chemical state information from the top 1-10 nm. Our XPS system achieves energy resolution of 0.45 eV, sufficient to resolve chemical shifts between oxidation states (Fe2+ vs Fe3+, Ti4+ vs Ti3+) and distinguish functional groups (C-C, C-O, C=O, O-C=O in carbon spectra).
Angle-resolved XPS (ARXPS) varies the detection angle to construct compositional depth profiles non-destructively. Depth profiling with Ar ion sputtering extends this to tens or hundreds of nanometers, revealing layered structures such as core-shell nanoparticles and surface-modified coatings. Energy dispersive X-ray spectroscopy (EDS) attached to our SEM and TEM instruments provides rapid elemental mapping with spatial resolution down to the nanometer scale in STEM mode — ideal for confirming compositional uniformity, detecting contaminants, and visualizing elemental distributions in heterogeneous nanostructures.
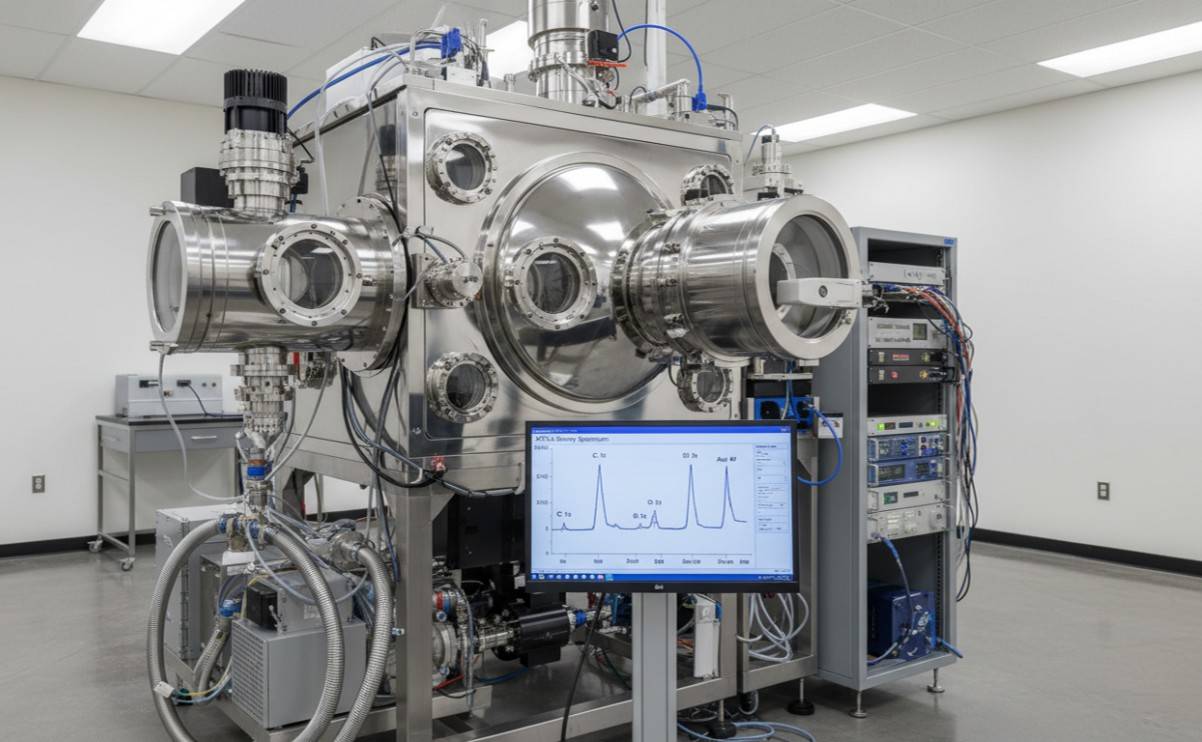 Figure 3: Ultra-high vacuum X-ray photoelectron spectrometer with hemispherical energy analyzer
Surface Analysis Deliverables:
- XPS survey scans: Elemental identification of all species present above 0.1 atomic percent.
- High-resolution XPS: Chemical state analysis with peak fitting for oxidation states and functional groups.
- ARXPS depth profiling: Non-destructive compositional gradients over the top 10 nm.
- Ion sputter depth profiles: Deep profiles through coatings, shells, and multilayer structures.
- STEM-EDS mapping: Nanoscale elemental distribution with sub-nm spatial resolution.
- EDS point analysis: Quantitative composition at specific locations on particles or films.
Optical and Photoluminescence Characterization Services
Optical properties often constitute the primary functional metric for nanomaterials used in displays, solar cells, biosensing, and photocatalysis. Our UV-Vis-NIR spectrophotometers record absorption spectra from 190 to 3200 nm, capturing interband transitions in semiconductors, surface plasmon resonances in metal nanoparticles, and ligand-to-metal charge transfer bands in coordination complexes. Photoluminescence spectroscopy measures emission spectra, excitation spectra, and quantum yields for fluorescent and phosphorescent nanomaterials including quantum dots, carbon dots, upconversion nanoparticles, and perovskite nanocrystals.
Time-resolved photoluminescence (TRPL) using time-correlated single photon counting (TCSPC) resolves fluorescence lifetimes from picoseconds to microseconds, revealing radiative and non-radiative recombination pathways. Raman spectroscopy with multiple excitation wavelengths (488, 532, 633, 785 nm) probes molecular vibrations, crystal lattice phonons, and carbon hybridization states. Surface-enhanced Raman scattering (SERS) on plasmonic substrates amplifies signals by factors of 10^6 to 10^12 for trace molecular detection. Fourier-transform infrared (FTIR) spectroscopy identifies surface functional groups, ligand compositions, and chemical bonding configurations through mid-infrared absorption.
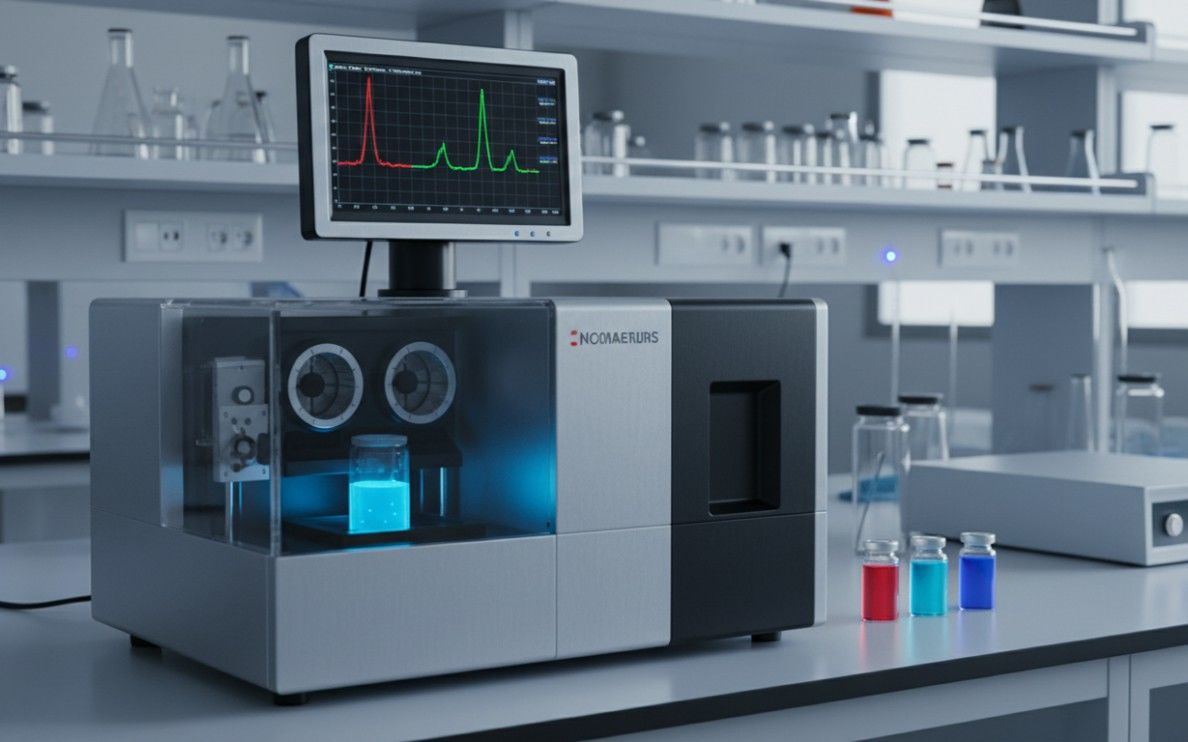 Figure 4: Spectrofluorometer measuring photoluminescence emission of quantum dot solutions
Optical Characterization Suite:
| Technique | Wavelength Range | Application |
| UV-Vis-NIR | 190 - 3200 nm | Bandgap, plasmon, absorption |
| Photoluminescence | 250 - 1700 nm | Quantum yield, emission spectra |
| TRPL (TCSPC) | Time-resolved | Fluorescence lifetime, recombination |
| Raman | Multiple lasers | Phonons, carbon hybridization, SERS |
| FTIR | 4000 - 400 cm-1 | Functional groups, ligand chemistry |
Thermal Stability and DSC/TGA Analysis Services
Thermal analysis provides critical insights into the stability, composition, and phase behavior of nanomaterials across temperature ranges. Thermogravimetric analysis (TGA) continuously monitors sample mass as temperature increases, revealing decomposition temperatures, organic ligand loadings, moisture content, and residual solvent. Our TGA systems operate from ambient to 1000 degrees C under nitrogen, air, or controlled gas mixtures, with microbalance sensitivity of 0.1 ug. For nanomaterials with organic surface coatings, TGA quantifies ligand density — a key parameter for quality control and functionalization reproducibility.
Differential scanning calorimetry (DSC) measures heat flow associated with phase transitions, glass transitions, melting, crystallization, and chemical reactions. Our simultaneous thermal analysis (STA) instruments combine TGA and DSC in a single measurement, correlating mass changes with thermal events. Modulated DSC separates reversible (heat capacity) from irreversible (kinetic) thermal events, enhancing resolution of overlapping transitions. For nanomaterials with confined geometries, we observe melting point depression and shifted phase transition temperatures that deviate dramatically from bulk values — phenomena that require precise thermal characterization for reliable application design.
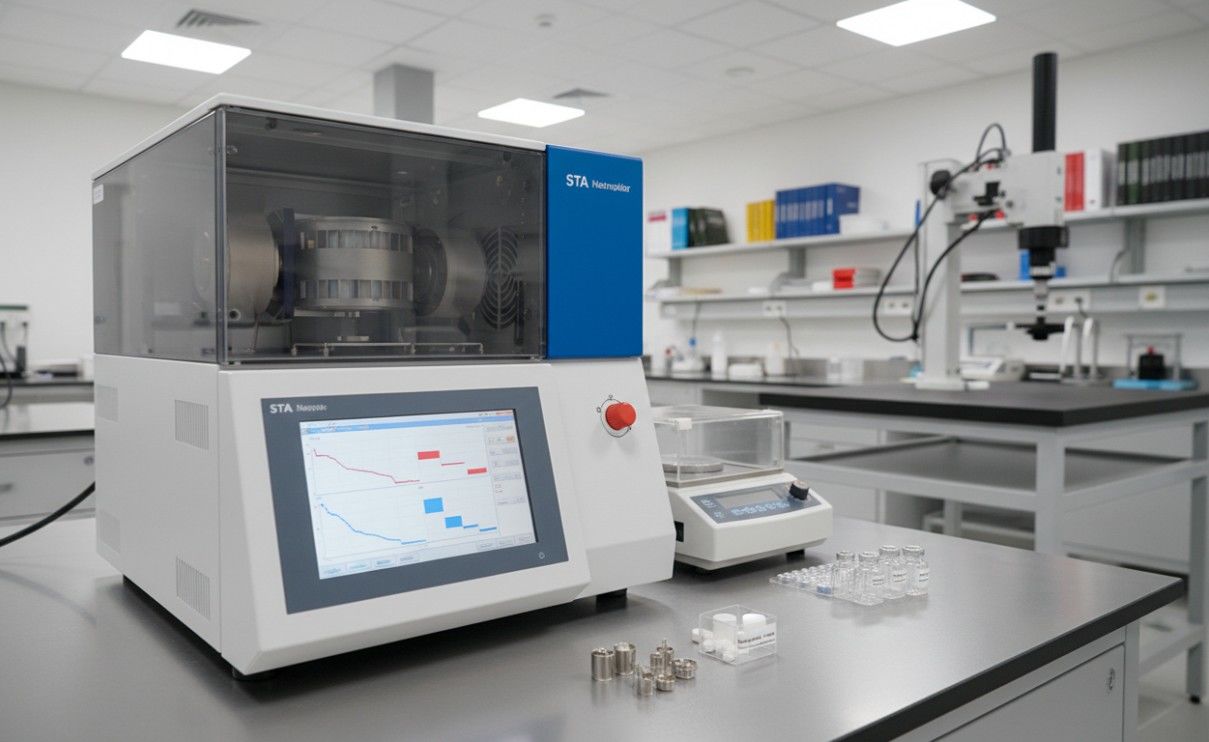 Figure 5: Simultaneous thermal analyzer combining TGA and DSC with heating stage and sample crucibles
Thermal Analysis Parameters:
- TGA: Temperature range 25-1000 C, heating rates 0.1-100 C/min, atmospheres: N2, air, O2, Ar, CO2.
- DSC: Heat flow sensitivity 0.04 uW, temperature range -90 to 550 C, modulated DSC capability.
- STA (TGA-DSC): Simultaneous mass and heat flow measurement for comprehensive thermal profiles.
- Ligand loading quantification: Organic content determination for surface-functionalized nanoparticles.
- Phase transition mapping: Melting, crystallization, glass transition, and decomposition analysis.
Magnetic Property Characterization Services (VSM)
Magnetic nanomaterials require precise characterization of their response to applied magnetic fields — parameters that determine performance in hyperthermia, MRI contrast enhancement, magnetic separation, drug targeting, and data storage. Our vibrating sample magnetometer (VSM) measures magnetization curves at room temperature and cryogenic temperatures (2-400 K) under applied fields up to 3 Tesla. From these curves we extract saturation magnetization (Ms), remanent magnetization (Mr), coercivity (Hc), and squareness ratio — the complete hysteresis profile that defines a material's magnetic identity.
For superparamagnetic iron oxide nanoparticles, zero coercivity and remanence at room temperature confirm the absence of magnetic hysteresis — a prerequisite for safe biomedical applications where particles must not agglomerate after field removal. Zero-field-cooled (ZFC) and field-cooled (FC) magnetization curves identify blocking temperatures that correlate with particle size and anisotropy. AC susceptibility measurements characterize the frequency-dependent magnetic response relevant to magnetic particle imaging (MPI) and hyperthermia applications where heating efficiency depends on relaxation dynamics in alternating magnetic fields.
VSM Measurement Capabilities:
- Hysteresis loops: M-H curves at 300 K and variable temperatures, fields up to 3 T.
- Saturation magnetization: Ms values for pure and surface-coated magnetic nanoparticles.
- Coercivity and remanence: Hc and Mr for assessing superparamagnetic vs. ferromagnetic behavior.
- ZFC-FC curves: Blocking temperature determination and size distribution analysis.
- AC susceptibility: Frequency-dependent magnetic response for MPI and hyperthermia optimization.
Electrical Conductivity and Carrier Mobility Testing Services
Nanomaterials for electronic, optoelectronic, and energy applications demand thorough electrical characterization. Our four-point probe and van der Pauw measurement systems determine sheet resistance, resistivity, and conductivity of nanomaterial thin films, nanowire networks, and pressed powder pellets without contact resistance artifacts. For semiconducting nanomaterials, Hall effect measurements quantify carrier concentration, carrier mobility, and conductivity type (n-type or p-type) — parameters essential for transistor design, photodetector optimization, and thermoelectric materials development.
Dielectric spectroscopy characterizes the frequency-dependent permittivity and dielectric loss of nanocomposite materials and ceramic nanoparticles across the range from 10^-2 to 10^7 Hz. Impedance spectroscopy resolves grain boundary, bulk, and electrode contributions to electrical transport in nanostructured ceramics and composite electrolytes. For 2D materials such as graphene and transition metal dichalcogenides, we fabricate back-gated field-effect transistor devices on-chip to extract field-effect mobility, on/off ratio, and contact resistance — providing device-relevant figures of merit that go beyond bulk conductivity measurements.
Electrical Characterization Techniques:
- Four-point probe: Sheet resistance and conductivity of thin films and nanomaterial coatings.
- Hall effect measurement: Carrier concentration, mobility, and type for semiconducting nanomaterials.
- Dielectric spectroscopy: Frequency-dependent permittivity and dielectric loss (10 mHz to 10 MHz).
- Impedance spectroscopy: Electrical transport mechanisms in nanocomposites and ceramic materials.
- FET device fabrication & testing: On-chip field-effect mobility for 2D materials and nanowires.
Mechanical Property and Nanoindentation Testing Services
Mechanical properties of nanomaterials and nanostructured coatings often differ dramatically from their bulk counterparts due to size effects, surface dominance, and microstructural refinements. Our nanoindentation systems apply precisely controlled loads from micronewtons to millinewtons while continuously monitoring displacement, generating load-displacement curves from which hardness, elastic modulus, creep, and fracture toughness are extracted according to the Oliver-Pharr method. Berkovich, spherical, and cube-corner indenter tips accommodate soft polymers, hard ceramics, and brittle thin films respectively.
Nanofiber tensile testing on individual fibers with diameters below 1 um measures Young's modulus, tensile strength, and elongation at break using specialized micro-tensile stages. Dynamic mechanical analysis (DMA) characterizes viscoelastic properties of nanocomposites — storage modulus, loss modulus, and tan delta — as functions of temperature, frequency, and strain amplitude. These measurements are particularly valuable for nanofiller-reinforced polymer composites where small loading fractions can dramatically alter stiffness, damping, and glass transition behavior.
Mechanical Testing Capabilities:
- Nanoindentation: Hardness and elastic modulus from sub-micron to nanometer penetration depths.
- Scratch testing: Adhesion and cohesive strength of nanostructured coatings and thin films.
- Nanofiber tensile testing: Single-fiber stress-strain curves for electrospun and drawn nanofibers.
- DMA: Viscoelastic properties of nanocomposites from -150 to 600 C.
BET Surface Area and Porosity Analysis Services
Surface area and porosity govern the catalytic activity, adsorption capacity, drug loading potential, and electrochemical performance of porous nanomaterials. Our physisorption analyzers measure nitrogen adsorption-desorption isotherms at 77 K to determine specific surface area via the Brunauer-Emmett-Teller (BET) method, pore size distribution through Barrett-Joyner-Halenda (BJH) or density functional theory (DFT) models, and total pore volume. The technique accommodates powders, pellets, thin films, and monolithic samples with surface areas ranging from 0.01 to over 3000 m2/g.
The shape of the adsorption isotherm — classified as Type I through Type VI — provides immediate insight into pore geometry. Type I isotherms indicate microporous materials (pores < 2 nm) such as zeolites and activated carbons. Type IV isotherms with hysteresis loops characterize mesoporous materials (2-50 nm) including MCM-41, SBA-15, and most metal-organic frameworks. For nanomaterial classification under EU regulatory guidelines, BET surface area combined with particle morphology serves as a primary screening parameter — volume-specific surface area (VSSA) exceeding 60 m2/cm3 strongly indicates nanoscale dimensions.
BET Analysis Deliverables:
- BET surface area: Multi-point BET with linear regression and correlation coefficient.
- Pore size distribution: BJH and DFT models for mesopore and micropore analysis.
- Total pore volume: Single-point pore volume at P/P0 = 0.99.
- Adsorption isotherm classification: Type I-VI identification with hysteresis loop analysis.
- CO2 adsorption at 273 K: Enhanced micropore characterization for sub-0.7 nm pores.
Dispersion Stability and Rheology Analysis Services
Nanoparticles in suspension are thermodynamically driven to aggregate due to van der Waals attraction. Understanding and quantifying dispersion stability is essential for any application involving liquid-phase processing — from inkjet printing of conductive nanoparticle inks to intravenous injection of drug-loaded nanocarriers. Our dispersion stability characterization combines multiple complementary approaches: accelerated aging under centrifugal force measures sedimentation kinetics; turbidity scanning (Turbiscan) detects particle migration and aggregation non-invasively; and multiple light scattering monitors formulation stability over time under varying temperature and ionic strength conditions.
Rheological characterization determines how nanomaterial-loaded fluids respond to deformation — properties that influence processability, injectability, coating uniformity, and printability. Rotational rheometry measures shear viscosity across shear rates from 10^-3 to 10^4 s^-1, capturing Newtonian, shear-thinning, and shear-thickening behaviors. Oscillatory rheology quantifies the viscoelastic modulus (G' and G'') as functions of frequency and strain amplitude, identifying the linear viscoelastic region and gelation points for nanocomposite hydrogels and concentrated nanofluid suspensions.
Dispersion & Rheology Services:
- Accelerated stability testing: Centrifugation and temperature cycling to predict shelf life.
- Turbiscan analysis: Non-invasive detection of particle migration, creaming, and sedimentation.
- Shear rheology: Viscosity curves, yield stress, and thixotropic loop measurements.
- Oscillatory rheology: Storage modulus, loss modulus, and tan delta vs. frequency and strain.
- Injectability testing: Flow rate and force measurements through clinical gauge needles.
ICP-MS Elemental Purity and Trace Analysis Services
Elemental purity directly impacts the performance, safety, and reproducibility of nanomaterials in research applications. Inductively coupled plasma mass spectrometry (ICP-MS) offers unmatched sensitivity for detecting trace metal impurities at parts-per-trillion (ppt) levels — critical for semiconductor-grade materials, catalysts, and biomedical nanoparticles where even ppb-level contaminants can alter properties or induce toxicity. Our ICP-MS systems detect over 70 elements simultaneously with detection limits as low as 0.01 ug/L, covering the full periodic table from lithium to uranium.
Sample preparation is tailored to each material matrix: microwave-assisted acid digestion dissolves metal and oxide nanoparticles; alkaline fusion handles refractory ceramics; and surface leaching protocols specifically extract adsorbed contaminants without attacking the core particle. For speciation analysis — distinguishing Cr(III) from Cr(VI), As(III) from As(V), or different mercury species — we couple liquid chromatography (HPLC) with ICP-MS to separate and quantify individual chemical forms. Internal standard calibration and matrix-matched quality control samples ensure accuracy across complex nanomaterial digest matrices.
ICP-MS Capabilities:
- Multi-element screening: 70+ elements from Li to U in a single measurement.
- Detection limits: Sub-ppt for most elements; 0.01 ug/L routine quantification.
- Nanoparticle dissolution: Microwave digestion with HNO3, HCl, HF, and H2O2 for complete matrix decomposition.
- HPLC-ICP-MS speciation: Cr(III)/Cr(VI), As(III)/As(V), methylmercury separation and quantification.
- Isotope dilution: Highest accuracy quantification for critical trace elements.
- EU nanomaterial screening: VSSA determination combined with ICP-MS for regulatory classification.
Request Your Nanomaterial Characterization Package
Send us your sample specifications and research objectives. Our team will recommend the optimal analytical workflow and deliver comprehensive, publication-ready results with expert interpretation.