

Dispersion Stability and Rheology Analysis Services
Nanoparticles possess enormous surface energy relative to their mass, making them thermodynamically prone to aggregation and sedimentation. A dispersion of 50-nanometer silica particles in water may appear uniform immediately after sonication, yet within hours the mean particle size can double as van der Waals attractions drive cluster formation. For researchers developing drug delivery formulations, this agglomeration compromises targeting efficiency. For those engineering thermal interface materials, settling destroys the percolation network essential for heat conduction.
Characterizing how nanoparticles behave in liquid media requires more than a single snapshot of particle size. Eata Nanomaterials offers an integrated dispersion stability and rheology analysis platform that tracks particle size evolution, surface charge, viscoelastic response, and sedimentation kinetics under realistic formulation conditions. Our multi-technique approach captures both the equilibrium state and the dynamic processes that determine long-term dispersion performance.
 Figure 1: Three vials showing different dispersion stability states: stable colloidal suspension, partial sedimentation, and complete phase separation with dense precipitate.
Dynamic Light Scattering for Hydrodynamic Particle Size
Dynamic light scattering (DLS), also known as photon correlation spectroscopy, measures the temporal fluctuations in scattered laser light intensity caused by Brownian motion of particles suspended in a fluid. Through autocorrelation analysis of these intensity fluctuations, the technique extracts the diffusion coefficient of the particles, which the Stokes-Einstein equation converts into a hydrodynamic diameter that includes the particle core, surface coatings, and associated solvent molecules.
Our DLS services provide:
- Hydrodynamic diameter (Dh) and polydispersity index (PDI) from cumulant analysis, indicating the mean particle size and width of the size distribution respectively. PDI values below 0.1 indicate monodisperse samples, while values above 0.4 suggest broad or multimodal distributions
- Intensity-based, volume-based, and number-based particle size distributions through advanced algorithms including CONTIN and non-negatively constrained least squares analysis, enabling identification of subtle aggregate populations that intensity-weighting alone may obscure
- Temperature-dependent sizing from 4 degrees Celsius to 90 degrees Celsius to probe thermoresponsive behavior, lower critical solution temperature transitions, and temperature-induced aggregation thresholds
- Kinetic monitoring of particle size evolution over hours to weeks, providing quantitative agglomeration rate constants and shelf-life predictions under specified storage conditions
DLS measurements are performed at a scattering angle of 173 degrees using backscatter detection geometry, which minimizes multiple scattering artifacts and enables analysis of concentrated turbid suspensions without excessive dilution that could alter the native dispersion state.
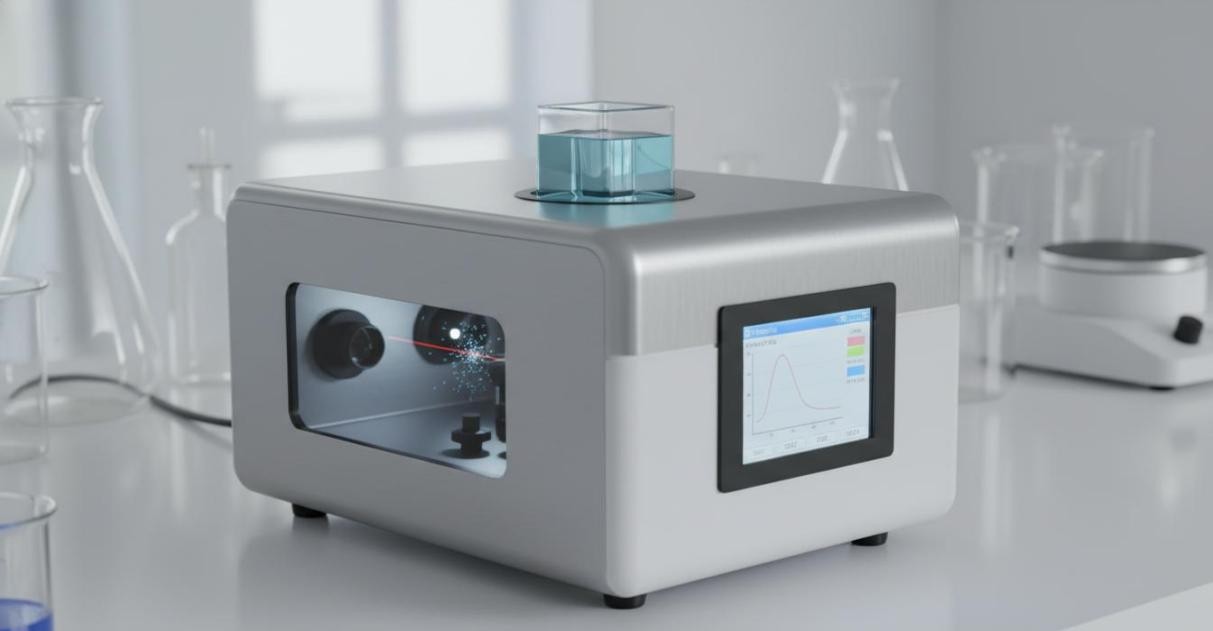 Figure 2: A dynamic light scattering analyzer with a laser source, detector optics, and a sample cuvette holder for measuring hydrodynamic particle size in colloidal dispersions.
Zeta Potential and Surface Charge Characterization
The zeta potential quantifies the effective electrical charge at the shear plane surrounding a particle in dispersion. This surface charge generates electrostatic repulsion between neighboring particles, and when the magnitude exceeds approximately 30 millivolts, the repulsive forces typically overcome attractive van der Waals interactions, conferring colloidal stability. Zeta potential measurement therefore serves as both a diagnostic tool for dispersion quality and a predictive indicator of formulation shelf life.
Eata Nanomaterials employs phase analysis light scattering (PALS) for zeta potential determination, a technique particularly suited for nanoparticle dispersions where traditional electrophoretic light scattering suffers from low signal-to-noise ratios. Our zeta potential services include:
- Electrophoretic mobility measurement and Smoluchowski or Huckel model conversion to zeta potential, with model selection based on the Debye length relative to particle radius for each ionic strength condition
- pH titration curves mapping zeta potential from pH 2 to pH 12, identifying the isoelectric point where surface charge reverses and dispersion stability is minimal
- Ionic strength series to evaluate how electrolyte addition compresses the electrical double layer and reduces zeta potential, simulating the effect of buffer salts and physiological media on dispersion stability
- Surfactant and dispersant screening through systematic zeta potential mapping as a function of additive concentration, identifying the optimal stabilizer dosage for maximum electrostatic or electrosteric repulsion
For formulations containing mixed particle populations or complex biological fluids, we offer differential zeta potential analysis that resolves distinct electrophoretic mobilities within polydisperse samples, providing charge information for each subpopulation individually.
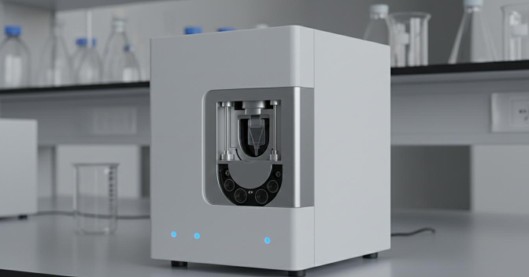 Figure 3: A zeta potential analyzer with electrophoretic light scattering capability and a folded capillary cell for measuring surface charge of colloidal nanoparticles.
Rotational Rheometry for Flow and Viscoelastic Properties
The flow behavior of a nanoparticle dispersion governs every processing step from formulation mixing to coating deposition to injection administration. Unlike simple Newtonian fluids where viscosity remains constant regardless of shear rate, nanomaterial suspensions frequently exhibit complex rheological behavior including shear-thinning, yield stress, thixotropy, and viscoelasticity. Understanding these properties is essential for optimizing formulation protocols and predicting in-use performance.
Our rotational rheometry laboratory is equipped with a stress-controlled rheometer featuring cone-plate, parallel plate, and concentric cylinder geometries to accommodate samples ranging from low-viscosity nanofluids to high-concentration pastes. Available measurement modes include:
- Flow curve measurements recording shear stress versus shear rate from 0.001 to 10,000 per second, revealing shear-thinning power-law indices, yield stresses, and Newtonian plateau viscosities essential for pump sizing and coating gap design
- Oscillatory amplitude sweeps identifying the linear viscoelastic region, storage modulus G-prime, and loss modulus G-double-prime, which distinguish solid-like gel networks from liquid-like dispersions
- Frequency sweeps from 0.01 to 100 radians per second characterizing the viscoelastic spectrum and relaxation times of polymer-stabilized or entangled nanoparticle networks
- Thixotropic loop tests quantifying the time-dependent structural breakdown and recovery of flocculated suspensions, critical for 3D printing inks and injectable formulations that must flow under shear yet solidify at rest
- Temperature ramp protocols from sub-ambient to 200 degrees Celsius for assessing thermal stability, gelation transitions, and phase separation onsets in thermally processed nanocomposites
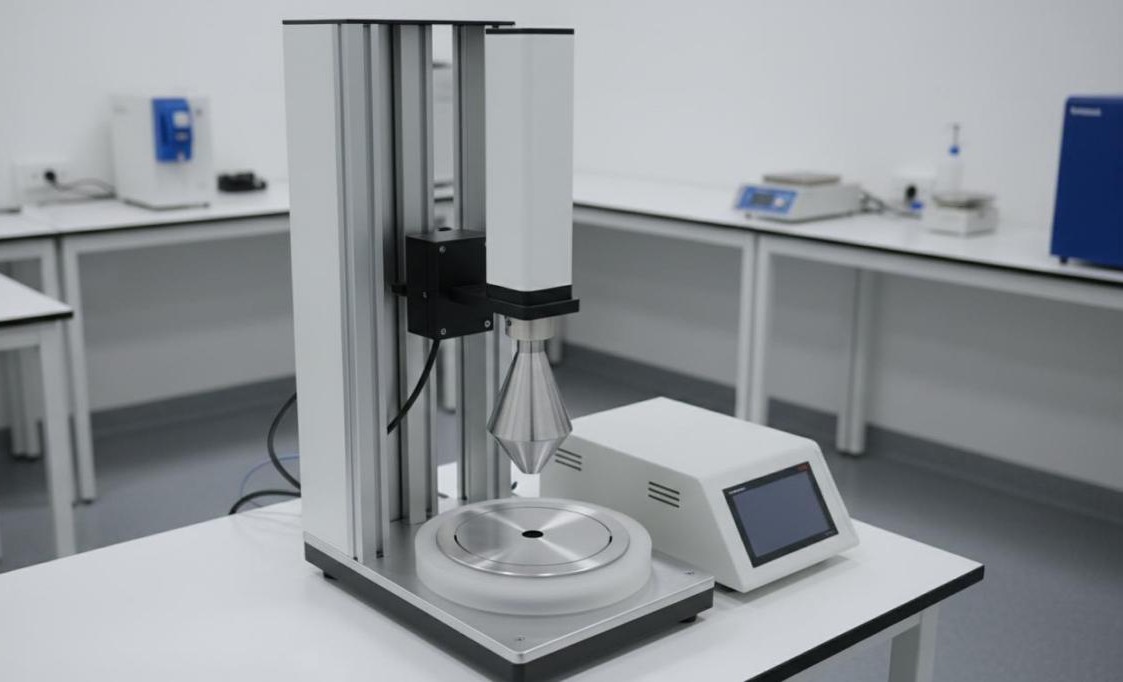 Figure 4: A rotational rheometer with cone-and-plate geometry and Peltier temperature-controlled base for precise flow and viscoelastic characterization of nanomaterial dispersions.
Interpreting Rheological Signatures of Nanoparticle Dispersions
Different nanomaterial systems produce characteristic rheological fingerprints that reflect their underlying microstructure. Recognizing these patterns enables rapid diagnosis of dispersion quality and informed formulation optimization:
- Dilute suspensions of well-dispersed spherical nanoparticles typically show near-Newtonian behavior with viscosity increasing modestly with particle volume fraction according to the Einstein-Batchelor equation. Deviations from this prediction signal aggregation or non-spherical particle shape
- Concentrated suspensions with strong interparticle attractions develop a yield stress and pronounced shear-thinning as shear disrupts the percolated network structure. The Herschel-Bulkley model captures this behavior, with the yield stress magnitude correlating directly with the strength of interparticle bonds
- Polymer-sterically stabilized dispersions exhibit viscoelastic behavior at high frequencies where the relaxation time of adsorbed polymer chains becomes comparable to the oscillation period. The crossover frequency between G-prime and G-double-prime marks the transition from entropic rubber-like response to viscous flow
- Magnetic and anisotropic nanoparticle suspensions may display shear-thickening at intermediate shear rates when hydrodynamic forces drive particle alignment and jamming, followed by shear-thinning at higher rates when the jammed structure refluidizes
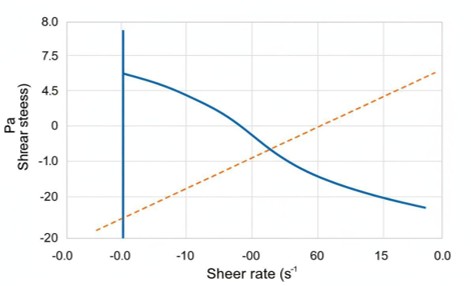 Figure 5: A flow curve showing shear-thinning behavior with a yield stress plateau at low shear rates, contrasting with a Newtonian reference line.
Multi-Technique Dispersion Stability Assessment
No single technique fully characterizes dispersion stability. DLS measures size but assumes spherical particles and can miss large sedimenting aggregates. Zeta potential predicts electrostatic stability but cannot detect steric stabilization mechanisms. Rheology probes bulk mechanical structure but requires relatively large sample volumes. Eata Nanomaterials integrates these complementary techniques into a unified stability assessment workflow:
- Initial characterization: DLS particle size, PDI, and zeta potential at the formulation pH and ionic strength establish the baseline dispersion state
- Accelerated aging: samples are held at elevated temperature or subjected to freeze-thaw cycling, with periodic DLS and zeta potential measurements tracking degradation kinetics
- Sedimentation analysis: turbidity scanning or analytical centrifugation quantifies settling rates and compaction behavior under gravitational or centrifugal fields
- Rheological fingerprinting: flow curves and oscillatory data characterize the microstructural basis of stability, distinguishing electrostatic from steric and depletion stabilization mechanisms
- Correlative reporting: all data are synthesized into a stability index with actionable recommendations for formulation improvement, including optimal dispersant type and concentration, pH window, and storage conditions
Material Systems We Characterize
| Material System | Typical Conc. Range | Key Rheology | Stability Challenge |
| Metal oxide nanoparticles | 0.1-50 wt% | Shear-thinning, Yield stress | High density, Rapid settling |
| Carbon nanotube/graphene | 0.01-5 wt% | Highly shear-thinning | Entanglement, Reaggregation |
| Quantum dots | 0.001-1 wt% | Near-Newtonian | Ostwald ripening, Quenching |
| Lipid nanoparticles | 1-20 wt% | Viscoelastic gel | Temperature sensitivity |
| Polymer latex particles | 10-60 wt% | Shear-thinning, Thixotropic | Steric barrier degradation |
| Ceramic slurries | 30-70 vol% | Herschel-Bulkley | High solids, Viscosity build |
Sample Submission Guidelines
Effective dispersion analysis begins with thoughtful sample preparation and submission. Liquid dispersions should be submitted in their native formulation state without dilution unless specifically required for the measurement protocol. Minimum sample volumes are 1 milliliter for DLS and zeta potential, 5 milliliters for rheological characterization, and 10 milliliters for extended kinetic monitoring studies.
For samples dispersed in volatile or toxic solvents, sealed amber vials with minimal headspace prevent evaporation-induced concentration changes during transport. Dispersions in biological media should be shipped cold and analyzed promptly to prevent microbial growth that could alter particle size distributions. Dry nanoparticle powders can be submitted for redispersion in customer-specified solvents using our standardized sonication and homogenization protocols, with full documentation of the dispersion procedure provided in the report.
If you are interested in our products or services, please don't hesitate to contact us.