

BET Surface Area and Porosity Analysis Services
The specific surface area and internal pore architecture of a nanomaterial govern virtually every surface-driven process it participates in. A catalyst with a surface area of 500 square meters per gram offers orders of magnitude more active sites than a bulk counterpart, while a metal-organic framework with precisely tuned micropores can selectively adsorb gas molecules based solely on size exclusion. These textural properties determine how a material interacts with gases, liquids, biological entities, and electromagnetic radiation, making their quantitative characterization indispensable for rational materials design.
Eata Nanomaterials operates a fully automated gas sorption analysis platform capable of measuring specific surface areas from 0.01 to over 3,000 square meters per gram, with pore size analysis spanning the complete range from micropores below 0.35 nanometers to macropores exceeding 500 nanometers. Our multi-station instrument enables simultaneous analysis of multiple samples with independent degassing and measurement parameters, ensuring high throughput without compromising precision.
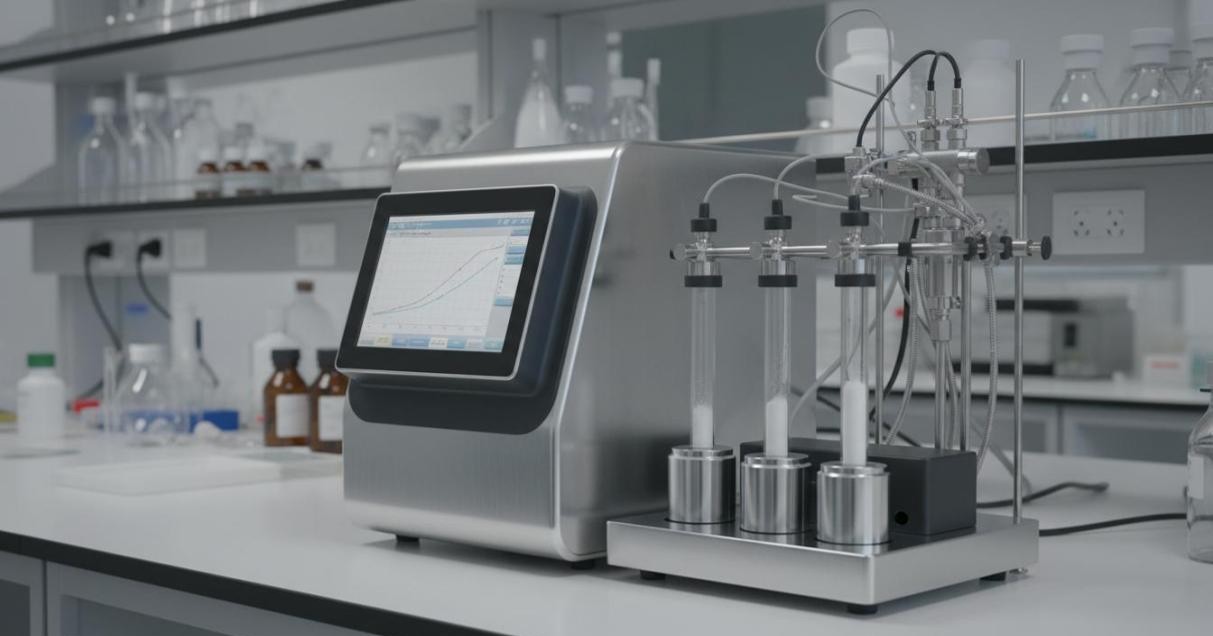 Figure 1: A fully automated multi-station BET surface area analyzer with glass sample tubes, gas manifold, and touchscreen data display in a materials characterization laboratory.
Multipoint BET Specific Surface Area Measurement
The Brunauer-Emmett-Teller (BET) method represents the internationally recognized standard for determining the specific surface area of solid materials. Based on multilayer physical adsorption theory, the technique measures how nitrogen molecules deposit onto a material surface at cryogenic temperature (77 Kelvin, liquid nitrogen boiling point). By recording the volume of gas adsorbed at multiple relative pressure points between 0.05 and 0.30 P/P0, the BET equation extracts the monolayer capacity, which when multiplied by the molecular cross-sectional area of nitrogen yields the total surface area normalized by sample mass.
Our BET surface area service delivers:
- Specific surface area in square meters per gram, determined from multipoint BET analysis with linear regression correlation coefficient typically exceeding 0.9999, following ISO 9277 methodology
- BET constant C value providing insight into the adsorbent-adsorbate interaction strength, which serves as a diagnostic indicator of surface chemistry and measurement validity
- Rouquerol plot analysis to verify that the chosen pressure range falls within the valid BET regime, ensuring that reported values represent true monolayer-multilayer transition rather than capillary condensation artifacts
- Cross-method validation through comparison with Langmuir surface area and single-point BET estimates for quality assurance
For samples with ultra-low surface areas approaching the detection limit, we offer krypton adsorption at 77 Kelvin as an alternative to nitrogen. Krypton's lower vapor pressure at this temperature enables reliable measurement of materials with specific surface areas as low as 0.01 square meters per gram, including dense ceramics, metallic foils, and thin films.
Pore Size Distribution by BJH and Advanced Methods
Beyond total surface area, the distribution of pore sizes within a material profoundly influences its functional performance. Mesopores between 2 and 50 nanometers facilitate molecular transport and serve as reservoirs in battery electrodes, while micropores below 2 nanometers provide high-density adsorption sites for gas capture applications. Eata Nanomaterials provides comprehensive pore structure analysis through multiple complementary theoretical frameworks:
- Barrett-Joyner-Halenda (BJH) method applied to the adsorption branch of the nitrogen isotherm, using the Kelvin equation to convert capillary condensation pressures into cylindrical pore diameters. This approach yields the mesopore size distribution from 2 to 50 nm along with cumulative pore volume curves
- Non-local Density Functional Theory (NLDFT) calculations using kernel files optimized for specific material classes including carbon slit pores, cylindrical silica pores, and zeolite channel geometries. NLDFT offers superior accuracy for micropore analysis below 2 nm where classical methods based on macroscopic fluid properties break down
- t-plot and alpha-s analysis to deconvolute micropore surface area and external surface contributions, providing a quantitative breakdown of where adsorption occurs within the pore hierarchy
- Total pore volume calculated from the amount of gas adsorbed at saturation relative pressure (P/P0 approaching 0.995), corresponding to complete filling of all accessible pores
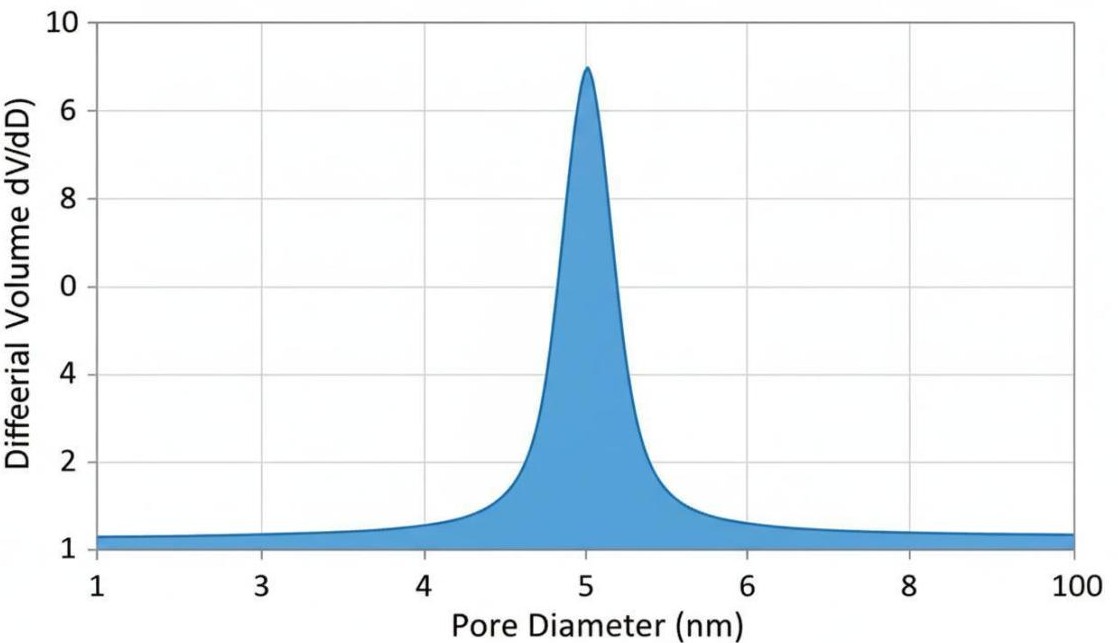 Figure 2: A BJH pore size distribution curve showing a sharp peak centered around 5 nm, indicating a well-defined mesoporous structure in the analyzed nanomaterial.
Nitrogen Adsorption-Desorption Isotherm Classification
The shape of an adsorption isotherm encodes fundamental information about the pore geometry and surface energetics of a material. According to the IUPAC classification system, different isotherm types and hysteresis loop shapes correspond to distinct pore structures. Our analysis service includes expert interpretation of isotherm morphology to guide materials understanding:
- Type I isotherms with steep uptake at low relative pressure and subsequent plateau indicate microporous materials such as zeolites, activated carbons, and MOFs, where pore filling occurs at pressures below capillary condensation thresholds
- Type IV isotherms featuring pronounced hysteresis loops signify the presence of mesopores. The H1 loop shape points to uniform cylindrical pores, while H2 loops indicate ink-bottle or cage-like pore geometries with narrow necks and larger bodies
- Type II isotherms observed on non-porous or macroporous materials reflect unrestricted multilayer adsorption on an open surface without confinement effects
- Type VI isotherms with stepwise adsorption layers reveal highly ordered surfaces with uniform energetic sites, characteristic of graphitic materials and certain 2D nanostructures
Each analysis report includes annotated isotherm plots with hysteresis loop classification and interpretation of the underlying pore architecture responsible for the observed adsorption behavior.
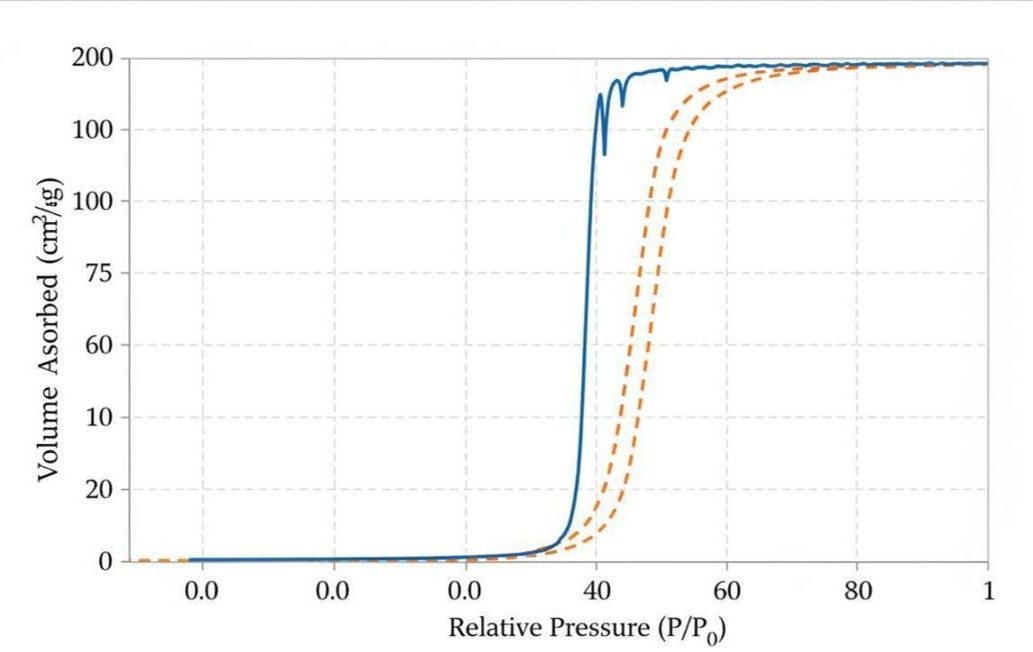 Figure 3: A representative Type IV nitrogen adsorption-desorption isotherm showing a distinct hysteresis loop characteristic of mesoporous materials with capillary condensation in the 0.4 to 0.8 P/P0 range.
Sample Degassing and Preparation Protocols
The reliability of BET analysis depends critically on proper sample preparation. Physically adsorbed water, organic contaminants, and residual synthesis solvents occupy surface sites and pore volumes, leading to artificially low surface area values if not removed prior to measurement. Eata Nanomaterials employs a dedicated degassing station with precise temperature and vacuum control for optimal sample pretreatment.
Our preparation workflow encompasses:
- In-situ degassing directly on the analysis station, eliminating exposure to atmospheric moisture between pretreatment and measurement. Samples are heated under dynamic vacuum with programmable temperature ramps to prevent structural damage from rapid outgassing
- Temperature optimization consultations to identify the highest safe degassing temperature for each material class, maximizing contaminant removal while preventing sintering, phase transitions, or thermal decomposition
- Vacuum level monitoring with turbomolecular pumping achieving ultimate pressures below 10^-3 Pascal, ensuring complete removal of volatile species even from narrow micropores
- Degassing completion criteria based on real-time pressure rise rate measurements rather than fixed time protocols, guaranteeing thorough preparation regardless of initial contamination level
Standard sample masses range from 50 to 500 milligrams depending on expected surface area and material density. We provide guidance on optimal sample quantity and particle sizing to minimize diffusion limitations while ensuring representative sampling.
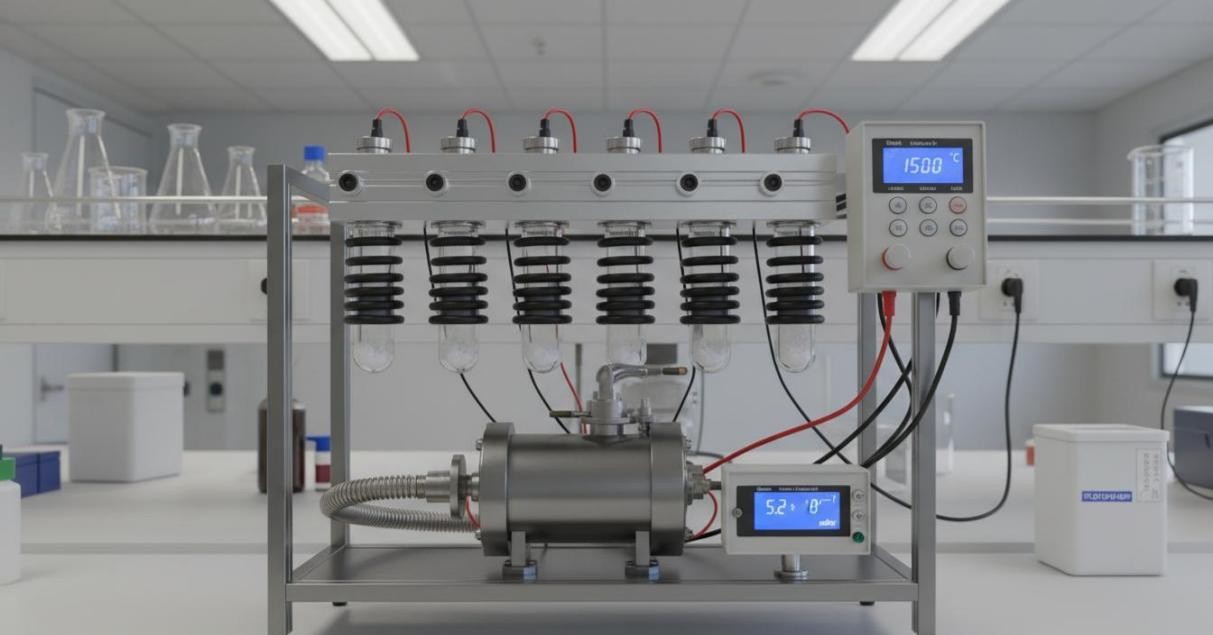 Figure 4: A vacuum degassing station with multiple heated sample ports, turbomolecular pump, and digital temperature controller for precise sample pretreatment before BET analysis.
Multi-Gas Adsorption Capabilities
While nitrogen at 77 Kelvin serves as the default adsorptive for routine surface area determination, certain research questions benefit from alternative probe molecules and measurement temperatures. Eata Nanomaterials offers an expanded gas sorption portfolio for specialized characterization needs:
- Argon adsorption at 87 Kelvin for microporous materials where nitrogen quadrupole interactions with polar surface groups can distort the BET analysis. Argon's spherical symmetry eliminates orientation-specific interactions, yielding more accurate surface areas for zeolites, MOFs, and oxide surfaces
- Krypton adsorption at 77 Kelvin for ultra-low surface area samples below 1 square meter per gram, leveraging krypton's lower saturation vapor pressure to achieve adequate measurement sensitivity
- Carbon dioxide adsorption at 273 Kelvin for micropore characterization in carbonaceous materials, where CO2's higher kinetic energy at this temperature enables faster equilibration and access to narrow pores that resist nitrogen diffusion at 77 Kelvin
- Water vapor adsorption at 298 Kelvin to evaluate hydrophilicity and surface chemistry, providing complementary information to contact angle measurements and XPS analysis
Application-Driven Analysis Reporting
Raw surface area and pore volume numbers carry limited value without context-specific interpretation. Each BET analysis report from Eata Nanomaterials includes application-focused discussion that connects measured textural parameters to anticipated material performance:
- Catalyst developers receive estimates of active site accessibility based on surface area and mesopore volume, along with recommended pore size targets for optimal substrate diffusion in specific reaction chemistries
- Battery researchers obtain insights into electrolyte infiltration pathways from pore connectivity analysis, and estimates of electrochemical double-layer capacitance derived from surface area normalized by electrode mass
- Gas separation membrane teams receive pore aperture distributions correlated to kinetic molecular diameter databases, supporting informed selection of target pore sizes for selective permeation applications
- Pharmaceutical formulation scientists receive surface area data linked to dissolution rate predictions and guidance on excipient compatibility based on hygroscopicity indicators from water vapor sorption measurements
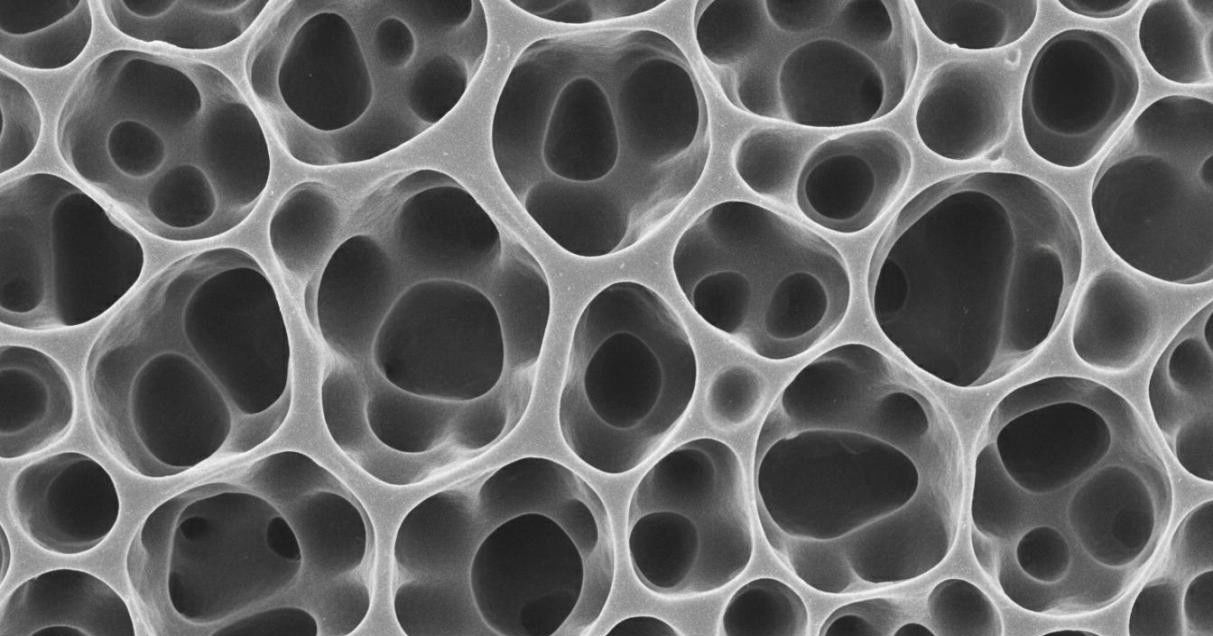 Figure 5: A high-resolution SEM micrograph revealing a well-developed three-dimensional pore network with interconnected mesopores and uniform pore wall morphology in a nanostructured porous material.
Typical Analysis Deliverables
Every BET and porosity analysis project includes a comprehensive report package containing all raw data, processed results, and expert interpretation. Standard deliverables encompass:
- Adsorption and desorption isotherm data tables with relative pressure, quantity adsorbed, and equilibrium time for every measurement point
- BET plot with linear fit parameters, correlation coefficient, and recommended pressure range for valid BET analysis
- BJH pore size distribution table and plot with differential and cumulative pore volume as functions of pore diameter
- Summary table of key textural parameters: specific surface area, total pore volume, average pore diameter, micropore surface area, and external surface area
- NLDFT pore size distribution when applicable, with kernel selection rationale and fit quality assessment
| Material Class | Typical BET Area | Pore Type | Common Use | Recommended Gas |
| Activated Carbon | 500-3000 m2/g | Micro- and mesopores | Gas storage, Filtration | N2 or CO2 |
| Zeolites | 300-700 m2/g | Micropores | Catalysis, Separation | Ar at 87K |
| MOFs | 1000-7000 m2/g | Micropores | Gas capture, Storage | N2 or Ar |
| Mesoporous Silica | 500-1500 m2/g | Mesopores (2-50nm) | Drug delivery, Catalysis | N2 |
| Metal Oxides | 10-200 m2/g | Mesopores | Sensors, Batteries | N2 or Kr |
Sample Requirements
Successful BET analysis begins with appropriate sample submission. Powder samples should be dry and free-flowing, with recommended quantities of 100 to 500 milligrams for routine surface area determination. For samples with anticipated surface areas above 1,000 square meters per gram, as little as 30 milligrams may suffice. Moisture-sensitive or air-reactive materials should be sealed under inert atmosphere in glass ampoules or glovebox-transferred containers.
Agglomerated powders, pellets, or monoliths should be lightly crushed prior to submission to ensure adequate gas diffusion throughout the sample bed. However, excessive grinding should be avoided as it can alter the native pore structure, particularly for fragile mesoporous frameworks. We offer in-house gentle grinding and particle size fractionation services for samples requiring size reduction before analysis.
If you are interested in our products or services, please don't hesitate to contact us.